
The bond market in five charts
- 08 November 2021 (5 min read)
As we approach the end of a volatile year in bond markets there’s plenty still going on with arguably something for everyone. Below we summarise five key things we are watching at the moment in managing our Global Strategic Bonds strategy.
Core rates
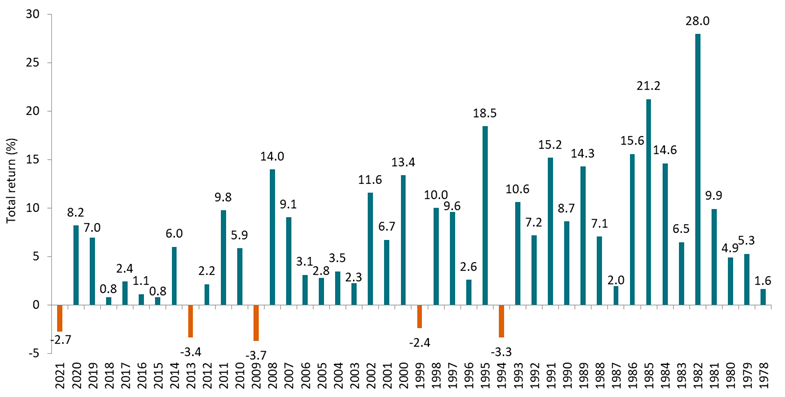
Yields on bond markets are moving back towards the highs we saw back in March 2021 and the focus is on inflation: where will it peak? How long will it last? How tolerant will central banks be? The market is pricing in less central bank support, tapering of QE and ultimately interest rates rises. This means that year-to-date bond index returns are poor. In many cases, government bond returns are at, or near, the worst ever. If that sounds dramatic then see the chart below and bear in mind that “worst ever” for US treasuries is -3.7%. However, the chart also shows that higher yields mean more carry and more carry means better chances to make money going forward- as we can see happened in 2014, 2010, 2000 and 1995.
Bearish commentary is telling us the 40-year bond bull market is over. We believe higher yields bring better opportunities, that the structural demand for fixed income is very strong, and interest rates will stay in a low yield environment for a long time to come. Much like in the first quarter of this year, we think opportunities to buy duration and to add long-dated high-quality interest rate risk will help us to continue delivering potentially attractive risk-adjusted returns going forward. For the moment, we have hedged much of our duration risk and are now focused on capital protection in the current bear market.
Chart 1: US treasury market index returns since 1978
Bond curves
Bond curves are not as complicated as people assume. Outright duration position is important, but the changing shape of the respective curve can be equally important. If you sell a 5-year bond and buy a 30-year bond (in equal amounts of duration ‘risk’), you will benefit if the 30-year outperforms the 5-year (and vice vera, across any different combination of maturity bands). So, when we talk about the “US 5-year 30-year curve” (5s30s), it should be thought of as a single instrument (or bond) – much like the 10-year treasury is a single bond. If you are long the instrument and the yield goes up (i.e. the curve “steepens” because 30-year underperforms 5-year), you lose money. If the 5s30s goes down (i.e. the curve flattens), you make money. Looking at the US 5s30s this year, we have seen some big moves (see chart 2, below).
In the first quarter, as bonds sold off, the 30-year underperformed the 5-year (i.e. the curve “bear steepened”). In the second and third quarters, the treasury market rallied and long-dated yields outperformed short-dated yields (i.e. “bull flattened”). But in September and October, bonds have sold-off, yet the curve has continued to flatten (“bear flattened”). In summary, we’ve seen a bit of everything. This year our strategy has typically been to sell long-dated when we are bearish and buy long-dated when are bullish. But this month we have positioned with short duration and a bear flattening bias (low duration exposure, but overweight long-dated and underweight short-dated).
The current market moves appear to be driven by two factors: 1) short-dated bonds are selling off as the market expectation is that we will see interest rate rises in the near term. This means that very short-dated bond are no longer ‘anchored’ by the expectation that central banks won’t hike. 2) Longer-dated bonds are now pricing in that the interest rate cycle will be relatively shallow and, after a small number of rate rises, the next moves will probably be down. This is supportive of the thesis that the inflation story, which is proving to be sticky in the short term, will ultimately be transitory. Although frankly the definition of “transitory” is one of the hardest calls in 2021. In the current environment we believe it makes sense to position for significant curve flattening in GBP, USD and EUR bonds.
Chart 2: US 5s30s curve: Three-year evolution

Inflation
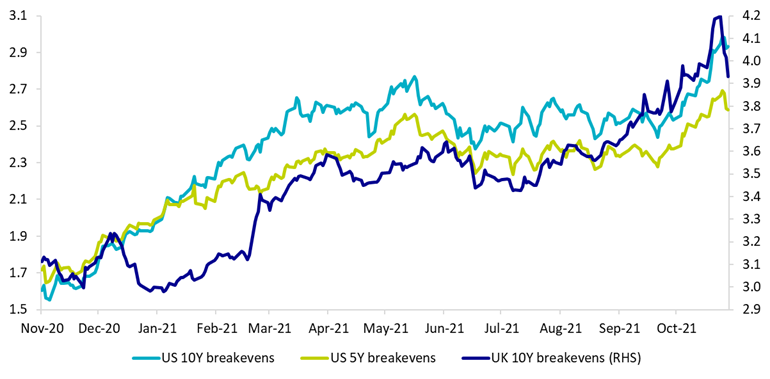
The higher inflation goes, and the longer it lasts, the higher breakevens are and the more money you make in inflation-linked bonds. Unsurprisingly in the current market context, the asset class has seen strong demand as investors look both to hedge their inflation risk and find an alternative to core government bonds. Earlier this month, markets got to such high, if not extreme levels, that US 5-year breakevens (3.0%) reached an all-time high, with US 10-year breakevens (2.7%) and UK 10-year breakevens (4.2%) getting close to record highs. In the last week or so we have seen the markets come off their highs as maybe investors look to book profits (and rotate back into “cheaper” government bond markets?). Something to watch for…
Linkers have been a strong contributor to our strategy this year, more recently we have taken exposure down somewhat as valuations are high, with the market pricing in a lot of future inflation and the asset class benefitting from strong demand.
Chart 3: US 5 year / 10 year / UK 10 year breakevens: last 12 months
Non-core government bonds
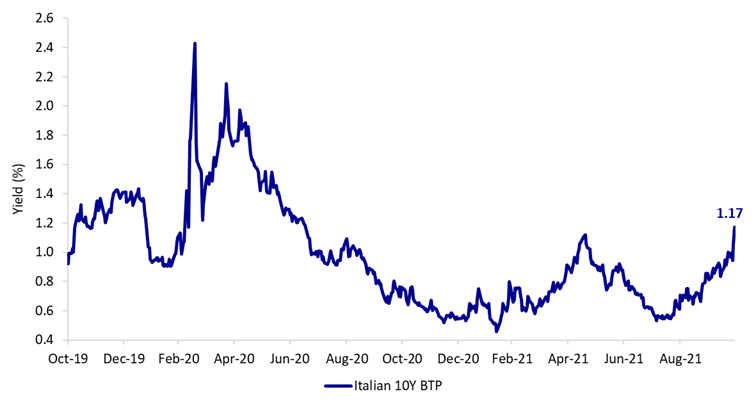
Italian sovereign bonds seem to be taking the brunt of the European bond sell off, with yields in early November reaching levels not seen since the heart of the COVID crisis in the first quarter of 2020. European bond markets do not seem to have been convinced by Christine Lagarde’s recent defence of the ECB bond buying programme and investors are pushing yields higher. Additionally, Spanish and Greek sovereign bonds are being pushed higher in yield, reminiscent of the previous weakness for ‘peripheral debt’. As an aside, 10-year Australian government bonds are have also risen sharply, as investors lose faith with central bank support and maybe we are seeing liquidity pressures in some of the non-core bond markets. We do not currently own any government bonds in non-core countries.
Chart 4: Italian 10-year BTP yield: Two-year evolution
Credit
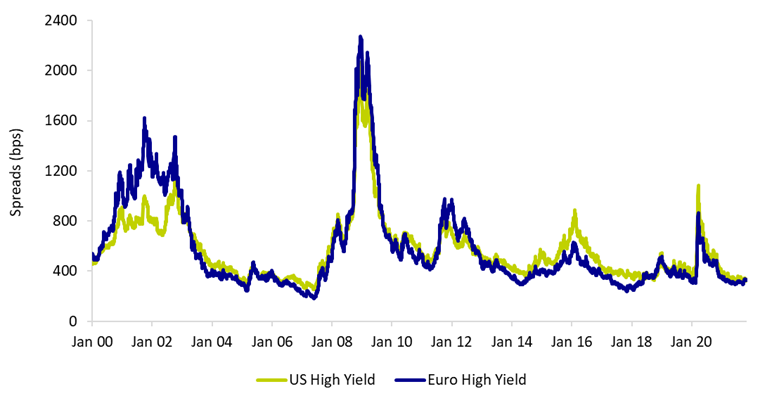
On the whole credit markets have been pretty dull. Credit spreads are at or near all-time lows and tights. Simplistically, the shorter duration and the longer credit risk you have been positioned, the better you will have done in 2021. As an extreme example, US high yield (short dated, higher credit risk asset class) is up 4.5% year-to-date (to 2 November), whereas sterling IG credit (long dated, lower credit risk asset class) is down 3% over the same period. Sterling credit is experiencing its second-worst year in 30 years but, unlike its worst year in 2008 which was driven by credit weakness, 2021 is driven mainly by interest rate weakness (i.e. higher government bond yields). Current valuations on most credit markets look expensive, but well supported. Default expectations are low, companies are doing well, and their ability to fund new debt is relatively easy. If this continues then spreads could easily stay where they are, or possibly go tighter. But at such tight levels (see chart below), the balance of risk/reward is possibly tilted towards credit weakness rather than credit strength on a forward-looking basis.
Chart 5: US and Euro high yield spreads since 2000
This year appears to be ending as it started, with bond yields driven higher around concern for higher inflation and less central bank support. Although inflation is certainly elevated, for longer than expected, there is still a view that it is transitory and should head lower over coming quarters.
Central banks’ response will be key and, should they prove to be less tolerant than many investors expect, we could see some volatility from both interest rate and credit sensitive assets. However, for most of 2021 we have seen government bond yields lower than many predicted as the continued “passive” demand from investors such as central banks and financially regulated entities remains a very positive flow dynamic. We do not see this environment changing materially and would view the current spike higher in yields as another opportunity to add duration and deliver decent returns in the medium term.
Disclaimer
This website is published by AXA Investment Managers Asia (Singapore) Ltd (ARBN 115203622) (“AXA IM Asia”). AXA IM Asia is exempt from the requirement to hold an Australian Financial Services License and is regulated by the Monetary Authority of Singapore under Singaporean laws, which differ from Australian laws. AXA IM Asia offers financial services in Australia only to residents who are “wholesale clients" within the meaning of Corporations Act 2001 (Cth).
This document is for informational purposes only and does not constitute investment research or financial analysis relating to transactions in financial instruments, nor does it constitute on the part of AXA Investment Managers or its affiliated companies an offer to buy or sell any investments, products or services, and should not be considered as solicitation or investment, legal or tax advice, a recommendation for an investment strategy or a personalized recommendation to buy or sell securities.
Due to its simplification, this document is partial and opinions, estimates and forecasts herein are subjective and subject to change without notice. There is no guarantee forecasts made will come to pass. Data, figures, declarations, analysis, predictions and other information in this document is provided based on our state of knowledge at the time of creation of this document. Whilst every care is taken, no representation or warranty (including liability towards third parties), express or implied, is made as to the accuracy, reliability or completeness of the information contained herein. Reliance upon information in this material is at the sole discretion of the recipient. This material does not contain sufficient information to support an investment decision.
All investment involves risk , including the loss of capital. The value of investments and the income from them can fluctuate and investors may not get back the amount originally invested.
Disclaimer
This website is published by AXA Investment Managers Australia Ltd (ABN 47 107 346 841 AFSL 273320) (“AXA IM Australia”) and is intended only for professional investors, sophisticated investors and wholesale clients as defined in the Corporations Act 2001 (Cth).
This publication is for informational purposes only and does not constitute investment research or financial analysis relating to transactions in financial instruments, nor does it constitute on the part of AXA Investment Managers or its affiliated companies an offer to buy or sell any investments, products or services, and should not be considered as solicitation or investment, legal or tax advice, a recommendation for an investment strategy or a personalized recommendation to buy or sell securities.
Market commentary on the website has been prepared for general informational purposes by the authors, who are part of AXA Investment Managers. This market commentary reflects the views of the authors, and statements in it may differ from the views of others in AXA Investment Managers.
Due to its simplification, this publication is partial and opinions, estimates and forecasts herein are subjective and subject to change without notice. There is no guarantee forecasts made will come to pass. Data, figures, declarations, analysis, predictions and other information in this publication is provided based on our state of knowledge at the time of creation of this publication. Whilst every care is taken, no representation or warranty (including liability towards third parties), express or implied, is made as to the accuracy, reliability or completeness of the information contained herein. Reliance upon information in this material is at the sole discretion of the recipient. This material does not contain sufficient information to support an investment decision.
All investment involves risk , including the loss of capital. The value of investments and the income from them can fluctuate and investors may not get back the amount originally invested.