
The cost of climate change: Action versus inaction
- 18 October 2021 (5 min read)
Key points
- The present global consensus to reduce greenhouse gas emissions to net zero will require immense investment
- Investment spending is not a cost but will boost activity. Costs will reflect increased production costs, taxes and regulations associated with reducing emissions
- A range of supra-national institutions estimate global GDP to be between +2.5% to -2% by 2050 after climate change mitigation actions. The cost of unmitigated climate change is estimated at a larger range of 3% to 30% of global GDP by 2100. The cost of global warming in the most conservative scenario is thus higher than the mitigation cost in the most pessimistic scenario
- A comparison of the two is complicated by near-term costs and far-distant benefits. The use of lower discount rates seems appropriate, which adds to arguments for intervention
- Differences will also occur across geographies, making a global comparison of costs different from individual assessments by countries and regions
The cost of avoiding catastrophic climate change
In November, the UK will host the United Nation’s 26th annual Conference of the Parties (COP26), which aims to tackle climate change. It has been described by the organisers as “the world’s best last chance to get runaway climate change under control.” The urgency for action has increased this year. The Intergovernmental Panel on Climate Change (IPCC) issued its latest update on physical sciences1 , concluding for the first time that it was unequivocal that “human influence has warmed the climate at a rate that is unprecedented in at least 2000 years” and that it was “more likely than not” that the 1.5 degree limit targeted in COP21 (Paris 2015) would be exceeded over the next 20 years.
The global community has begun to take heed. Both the US and China committed to net zero emission targets this year (by 2050 and 2060 respectively), joining most other large economies that had already made similar commitments. For now, global leaders appear united in their ambitions to limit warming greenhouse gas (GHG) emissions and prevent significant change in the world’s climate.
However, the commitment to reduce GHG emissions to net zero over the next few decades will require an enormous effort – a realignment of the global economy from the
ground up. This will likely include changes in almost every household, office building, factory, town, city and country on the planet. The scale of the challenge is staggering and its cost likely significant.
In this paper, we review the estimated costs of avoiding climate change. We deconstruct estimated spending plans to assess which individual elements will be a cost to the economy and which should be a benefit. We compare these to the estimated costs of allowing unabated climate change to continue. A simple comparison suggests that even before considering risks of non-linearities and unquantifiable biodiversity loss, the costs of avoiding climate change should prove far less than the costs of doing nothing. However, we also warn that simple comparisons do not account for the large time differences of incurred costs compared with expected benefits, considering the importance of discount rates to equate disparities over time.
We also briefly consider spatial disparities, with different countries and regions facing different net costs of abatement and change. This will add to the challenges in determining who should bear the brunt of abatement costs, but will also shape longer-term issues of growth, influence and migration for decades to come.
The costs of transition
As major countries have committed to more and more stringent emission targets, so estimates have materialised of the costs for these transformations. In a series of notes2 3 4 , we reviewed progress by the larger economies to put such policies in place, including estimated investment plans. Princeton University estimated that the US would need to invest $2.5tn (11% of GDP) by 2030 to deliver its net-zero-by-2050 goal. This is a major component of the US administration’s current spending plans due to pass Congress this month. The European Commission estimated an even larger €3.5tn over the coming decade (25% of GDP), with costs to be jointly met by both the public and private sector. Finally, University of Tsinghua estimated that China’s plans to reach net zero by 2060 would cost RMB 138tn ($21.6tn and 122% of GDP) over four decades – a straight line cost of 30% of GDP per decade (Exhibit 1).
Looking more broadly than at individual regions, the Organisation for Economic Co-operation and Development (OECD)5 concluded that $95tn in investment would be required in total over the next 15 years to deliver what it described as a “decisive transition”.
Exhibit 1: Investment estimates by region

Source: European Commission, Princeton University, Tsinghua University and AXA IM Research, 27 September 2021
Broader estimates exist for the investments required over the longer term. Morgan Stanley6 estimated that it would take $50tn of investment to transform five key industries – renewables, electric vehicles, hydrogen, carbon capture and storage (CCS) and biofuels. UBS7 estimated that it would require $120tn-$160tn in investment for the transition of the energy system alone between now and 2050. This range was echoed in reports from supranational agencies. The Network for Greening the Financial System (NGFS)8 estimated that the investment requirement to transform the energy sector would likely be over $60tn on current policies, but closer to $70tn in its net zero scenario (Exhibit 2). The International Renewable Energy Agency (IRENA)9 estimated $130tn in energy investment by 2030.
Exhibit 2: NGFS cumulative energy investment outlook
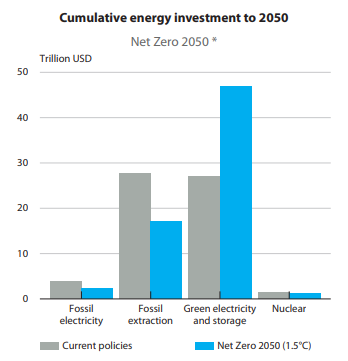
Source: NGFS, September 2021
Investment is not cost
What has been identified are estimates of investment plans, not costs. Investment is something that will deliver a boost to economic activity, directly boosting demand. Much of the initial investment is likely to be supported by public spending. The economist John Maynard Keynes discussed the positive role of government spending through the benefits of governments burying bottles stuffed with banknotes and letting private industry dig them up10 , although conceded that it “would be more sensible to build houses and the like”. The act of government spending can in some circumstances lift activity on its own. This is a key component of the European Union (EU)’s Next Generation fiscal package, which delivers necessary clean infrastructure investment as equally necessary fiscal stimulus.
Beyond the direct boost to activity that investment delivers, we can expect additional benefits:
Cost reductions. Investment in solar panels, spurred by government subsidisation in many countries, delivered a dramatic fall in costs over recent decades. Since 2010, the average price of solar panels has fallen by 82% in the US, to the equivalent of $0.068 per kilowatt hour (kWh), compared with coal at $0.32kWh, with solar and onshore wind now the cheapest sources of energy in the world11 . Future investment in other technologies is likely to lower the costs of other transitional costs, including carbon capture and storage (CCS), electric vehicles or future fuel cell technology.
Productivity boosts. Investment in new technologies should also increase efficiencies, boosting productivity and raising potential economic growth. More broadly, increased research and development spending often leads to additional and unsought benefits.
Exhibit 3: Decomposition of GDP impact of OECD plan
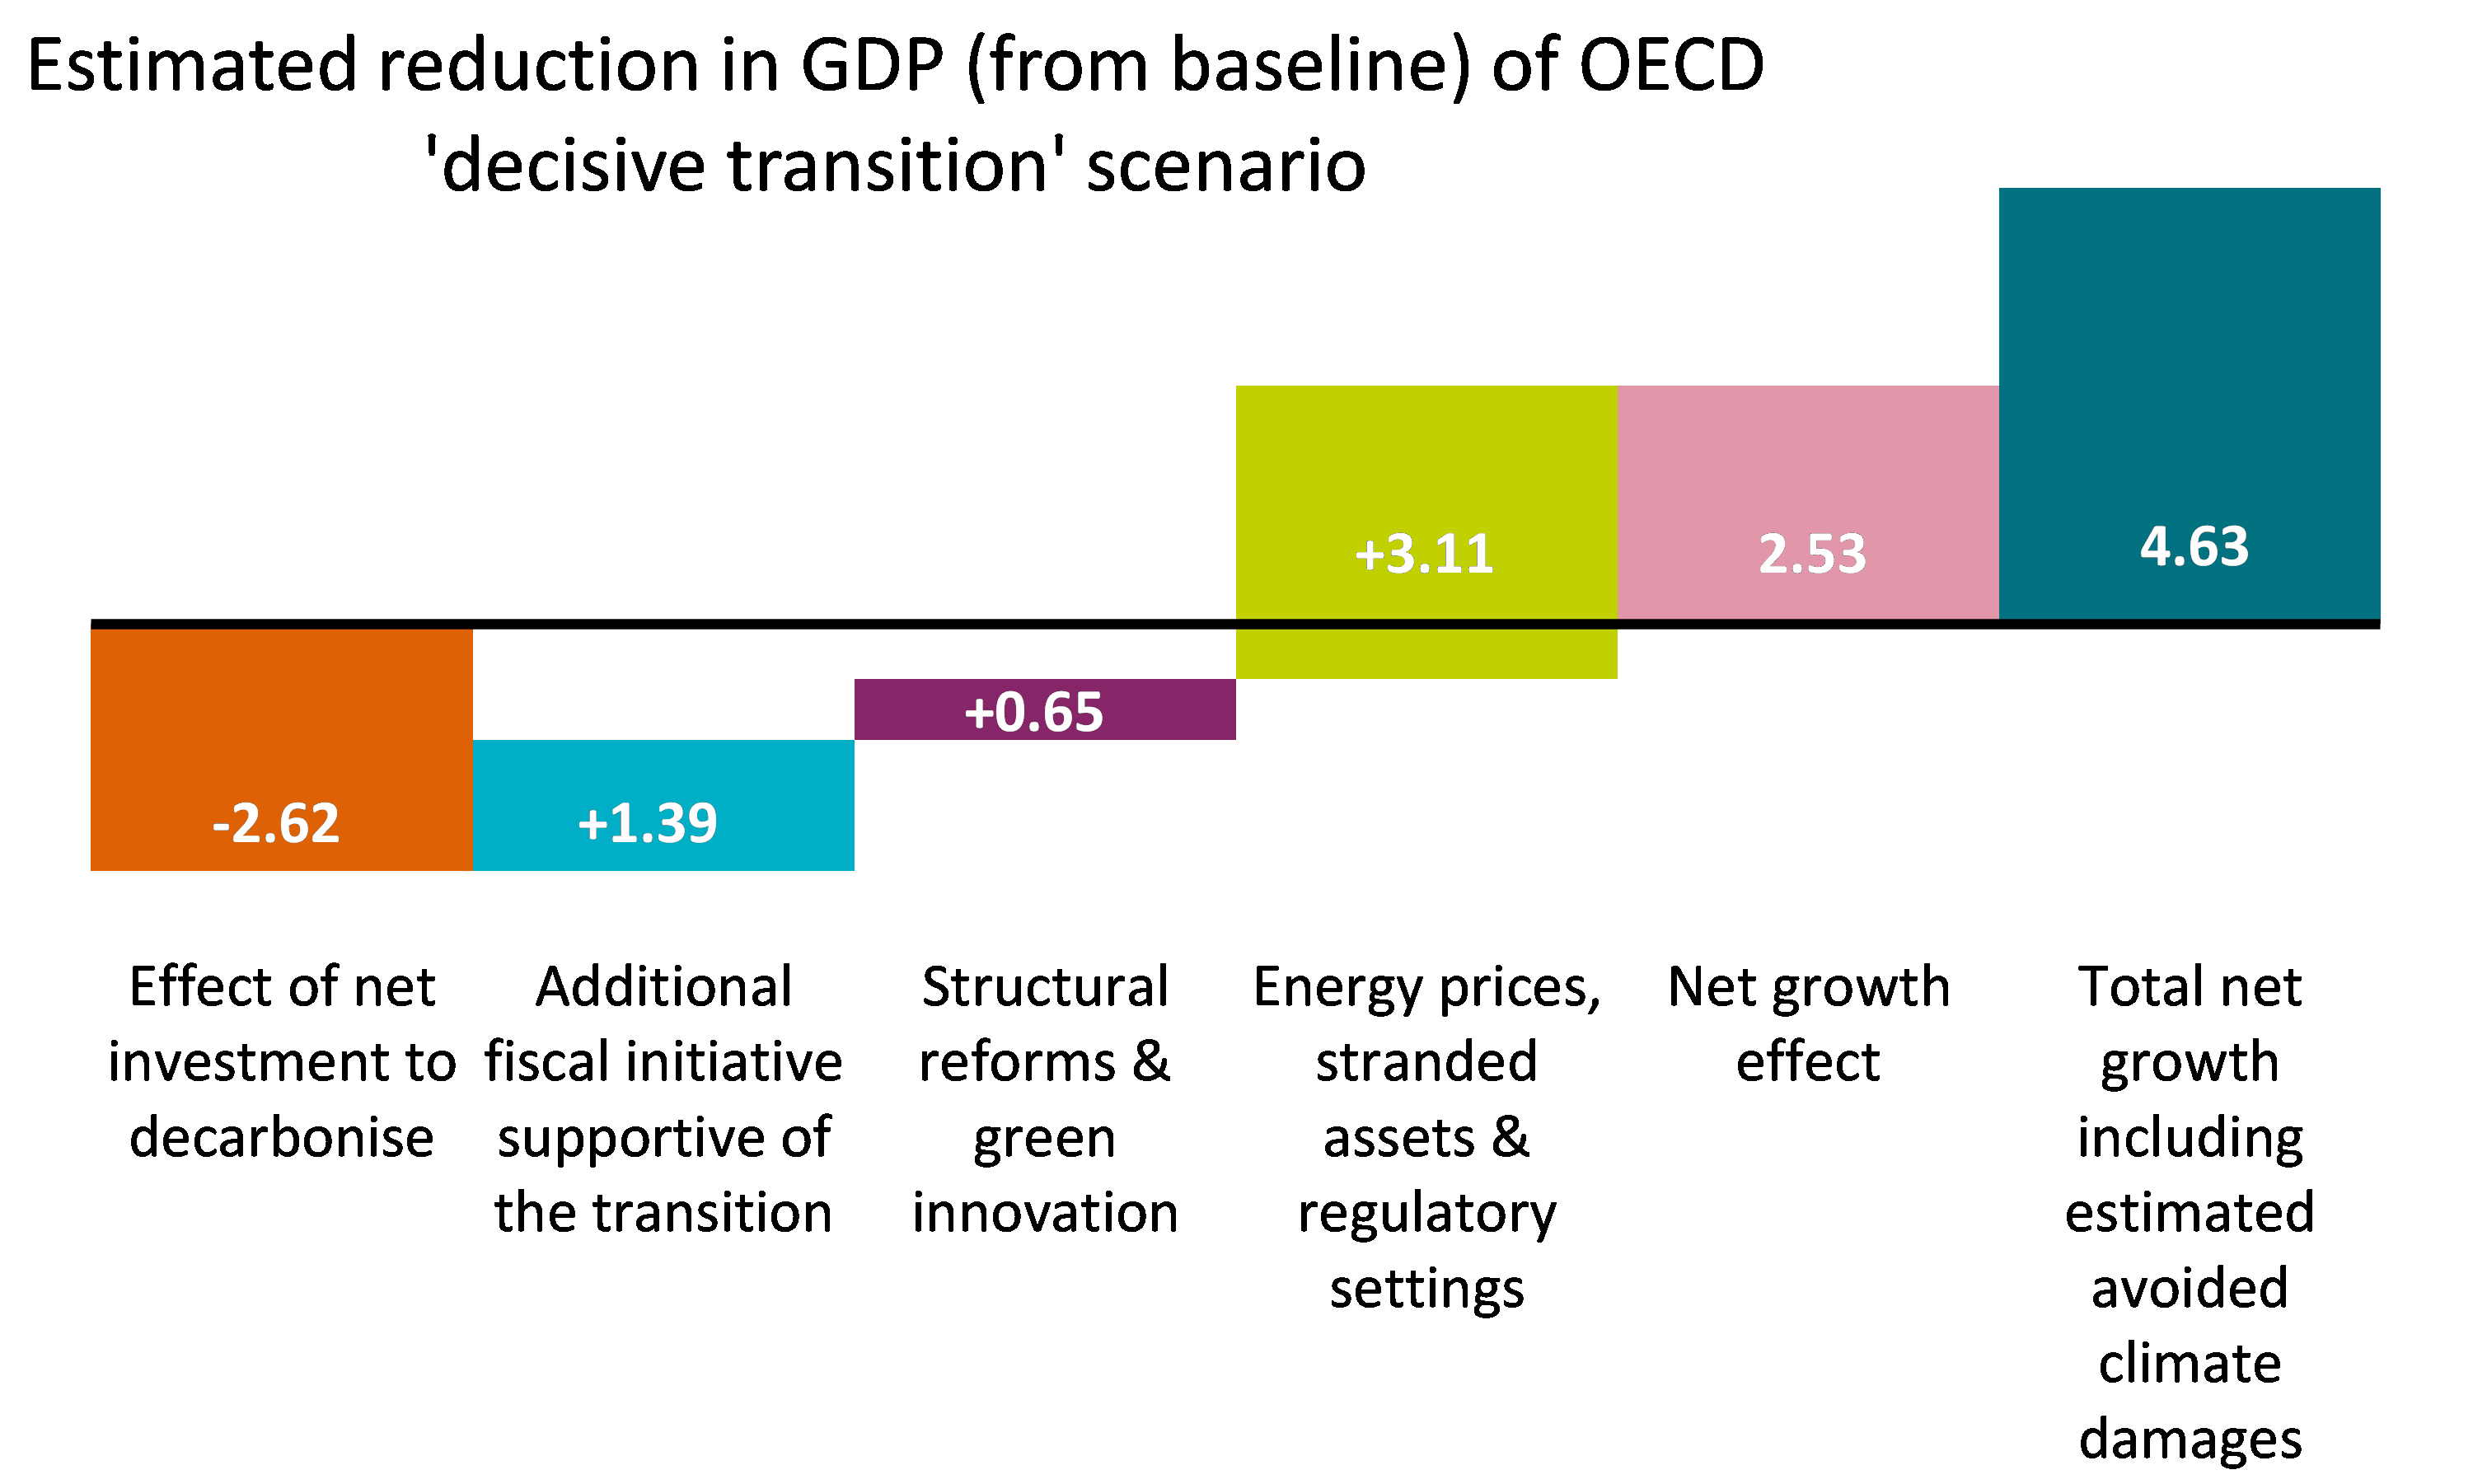
Source: OECD and AXA IM Research, 2017
Overcoming underinvestment, positive externalities. Infrastructure is a public good and as such is often underprovided (from a social optimum) in market economies. There are many examples of infrastructure underinvestment in even the world’s richest economies. Increased investment in key infrastructure may deliver additional positive externalities, for example increasing electricity grid resilience.
Health benefits. One special case of positive externality is likely to be seen in health benefits. The reduction of coal-fired generation and a decisive move to electrical vehicles (EVs) will reduce particulate emissions that contribute to poor air quality, which create a myriad of associated health problems, for example asthma. Reduced health problems should reduce future healthcare costs, lowering the net cost of the initial investment.
This distinction between investment and cost is clearly drawn out in several agencies’ assessments of the overall impact on growth. Exhibit 3 shows a decomposition of the OECD’s ‘decisive transition’ scenario on GDP. The OECD suggests that GDP would be 2.5% higher in this scenario (and 4.6% higher when compared to unchecked climate change). It estimates a positive boost to GDP of 1.4% delivered from the net investment to decarbonise (the broader lift was driven by an assumption of structural reforms leading to a 3.1% boost). Exhibit 4 illustrates a similar decomposition of the International Monetary Fund (IMF)’s baseline scenario, where it considers infrastructure investment lifting GDP by around 2% by 2050.
Exhibit 4: Decomposition of GDP impact of OECD plan
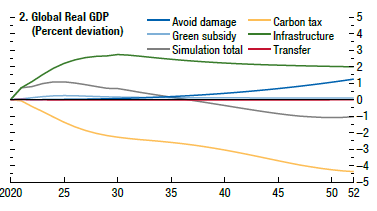
Source: IMF, October 2020
Endogenizing GHG emission externalities
The cost of avoiding climate change should therefore not be considered in terms of the gross expenditure needed to avoid climate change, but rather the lost output from the increased costs of reducing GHG emissions: Increased production costs associated with endogenizing the externalities of GHG emissions; increased tax to pay for public spending; an increased regulatory burden; opportunity costs of diverting investments from other potentially more rewarding scenarios; and the risks of stranded assets.
In broad terms climate change mitigation policy attempts to reduce GHG emissions from production methods by increasing those costs of production to a level that includes the negative externalities associated with their use. Green taxes would be a direct way of achieving this outcome. We could consider an increase in petrol duties, employed by most governments around the world, as a means of deterring consumption. However, this decrease in consumption reduces economic activity, incurring a cost.
Exhibit 5: EU ETS carbon price evolution

Source: Refinitiv and AXA IM Research, August 2021
In practice, a variety of methods have been used that are equivalent to such taxation. In recent research12 , we have detailed how the EU’s Emissions Trading System (ETS) sets a market price for carbon permits in the context of strict output limits for key industries. Exhibit 5 illustrates how – after initial teething problems – the price of carbon has risen quite sharply in recent years, illustrating a rising cost of production for those industries. China has just introduced its own ETS system.
Exhibit 6: Carbon price projections
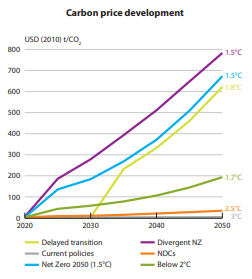
Source: NGFS, June 2021
While the cost of producing carbon has thus risen fivefold over the past few years in the EU, projections of future carbon cost increases are far higher. Exhibit 6 shows the NGFS’s outlook for carbon prices under different scenarios.
However, where output cannot be deterred by introducing market forces to try to limit emissions output, we can expect alternative measures. Direct taxation, carbon border tariffs to deter carbon leakage to high emission regions and regulation will all likely be part of the arsenal to reduce GHG emissions.
Moreover, the costs of avoiding climate change will be exacerbated by any increases in additional taxation required to fund public spending programmes and stranded assets. We argue that investment is not the measure of the cost of avoiding climate change – instead, this is the loss of output associated with increased taxation and regulatory restraint.
Estimates of the net cost of avoidance
The assessment of these combined effects – the positive contribution of increased investment spending, offset by the loss of output from increased production costs, taxation and regulation – is highly uncertain. Those attempting such assessments have delivered a range of estimates. We have cited the OECD’s assessment that a “decisive transition” could deliver a boost to global GDP of 2.5% by 2050. Other institutions are less optimistic about the net impact of change. The IMF estimates that in a scenario that would limit temperature increases to just 1.5 degrees, global GDP would be 1% lower by 2050.
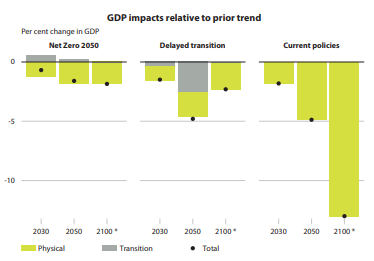
The NGFS considers different scenarios and estimates that a scenario consistent with net zero would likely reduce global GDP by around 2% by 2050 and 2100. However, it also estimates that in a ‘delayed transition’ that gets off to a later start, the costs of transition could be markedly higher, reducing GDP by around 5% by 2050, before losses are reduced to around 2.5% by 2100.
Exhibit 7: Carbon price projections
Source: NGFS, June 2021
The cost of unmitigated climate change
The comparison that matters is with the costs of unmitigated climate change – not a future extrapolation of current climate conditions. Exhibit 7 begins to examine this by including an assessment of output losses assuming the introduction of current policies alone. Here the NGFS estimates a loss of output of around 5% of global GDP by 2050 – similar to the ‘delayed transition’ scenario, although the loss is now
associated with physical, rather than transitional loss. For 2100, that figure jumps to 13%. We should also remember that a ‘current policies’ scenario may be a bad outcome in that light, but it is not a worst-case scenario.
Policies could easily deteriorate from this encouraging point of global agreement. Twice the US has backslid on international climate policy agreements, failing to ratify the Kyoto Protocol and the Paris Agreement, in both cases following the election of a Republican President. With President Joe Biden’s approval ratings slipping and, as yet, no policy passed that could not be overturned by any future President, the US’ commitment to avoiding climate change cannot be guaranteed over the coming decades. And nor can that of other countries. We thus consider the costs associated with unmitigated climate change.
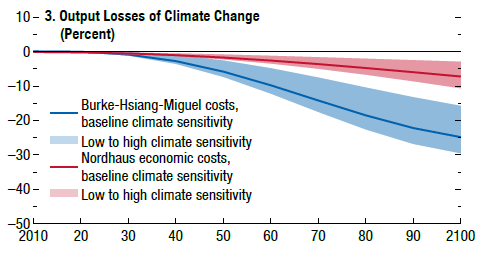
Once again, a number of institutions have produced estimates of losses to GDP from uninterrupted climate change. The NGFS estimates that losses would exceed 6% of global GDP by 2050. The OECD estimates that by 2100, total losses would total 10-12% of GDP. The IMF cites two separate models (Exhibit 8). The first considers a baseline loss of output of 7.5% of GDP by 2100 (a 3%-10% confidence range), while the second estimates 25% (15%-30% range).
Exhibit 8: Estimated impact of climate change
Source: IMF, October 2020
Inevitably such estimates are highly uncertain – as suggested by the range provided by the IMF. However, there are additional considerations. Technically, most models only consider linear models in baseline assessments, only including the risk of ‘tipping points’ – the start of feedback loops that can deliver non-linear adjustments, common in complex systems. Such non-linearities could dramatically escalate the costs of climate change.
More broadly, there are a number of potential additional costs to unmitigated climate change that are difficult to consider in economic models. One type reflects the difficulty of ascribing an economic value to things like biodiversity loss. Another includes broader, but unforeseen impacts on health – similar to our consideration of positive benefits from reducing emissions pollution on asthma, for example - there are likely to be health implications associated with warmer climates – beyond productivity changes. Finally, unmitigated
climate change would also inevitably lead to largescale population movement, as populations moved away from areas adversely affected by climate change (through flooding, reduced agriculture) to those areas less impacted. These significant movements would likely lead to additional economic impacts which are difficult to model.
Exhibit 9: IPCC estimates of five illustrative scenarios
Source: IPCC, Climate Change 2021, The Physical Science Basis, August 2021
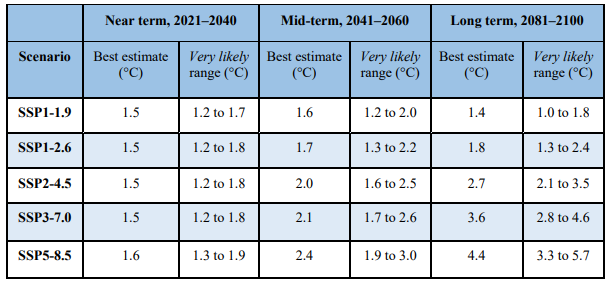
As such, we additionally consider a broader review of estimated costs. Exhibit 9 is an extract from the IPCC’s latest physical sciences assessment. It shows the IPCC’s assessment of five illustrative scenarios, two with low and very low GHG emissions – declining to net zero by 2050 (SSP1s); one with intermediate emissions – around current levels until mid-century (SSP2); and two with high and very high emissions – doubling by 2100 or 2050 (SSP3 and SSP5). It provides warming estimates for each scenario.
Exhibit 10: Uncertain impact of higher temperatures
Source: NGFS and IPCC, September 21
Exhibit 10 takes a chart summarising different academic estimates of the relationship between GDP loss and rising global temperatures from the NGFS’s latest report. We add an estimated line of best fit (green dotted line) and the IPCC’s temperature best estimates from the three scenarios that do not reach net zero emissions by 2050. This is a crude but illustrative portrayal of the range of impact that climate change could have, although again we warn that this is a linear approach and hence may still understate the risks.
Accounting for differences across time…
A simple comparison of estimated output losses in the unmitigated climate change scenarios – even the more
optimistic scenarios – appear large by comparison to the NGFS’ estimate of 2% loss in its net zero scenario. However, Exhibit 11 illustrates a key challenge at the heart of comparing the costs and benefits of avoiding climate change mitigation: to avoid climate change there is a significant upfront investment and cost in exchange for benefits that mainly accrue a long time in the future. It is not that we do not care about these long-distant events because they will not affect us, but rather that future flows should be ‘discounted’ to represent the opportunity cost of alternative actions that could otherwise have been taken.
Exhibit 11: Long-term output gains from mitigation
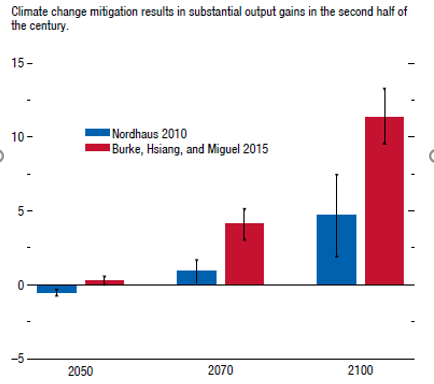
Source: IMF, October 2021
In the case of climate change, the progress of technology is a very specific reason to weigh the timing of intervention. The longer we wait, the more chance there is that some new technology will materially reduce the costs associated with preventing climate change and hence reduce the costs of transition. In the current context this might include the development of successful and cheap CCS technology. As such, it is important to assess the net benefits of intervention, which includes an assessment of the appropriate discount factor.
This debate became public in 2006. Nicholas (now Lord) Stern produced a landmark study in the UK13 , which used a variety of estimation techniques and concluded that “the benefits of strong and early action far outweigh the economic costs of not acting”. This conclusion sparked controversy and was swiftly rebutted by William Nordhaus, whose paper published by the National Bureau of Economic Research14 concluded that Stern’s report “depends decisively on the assumption of a near-zero social discount rate”.
Exhibit 12: Uncertain impact of higher temperatures
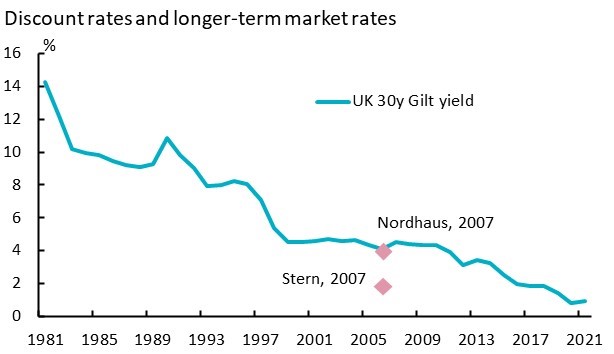
Source: Refinitiv and AXA IM Research, September 2021
Nordhaus showed that by using a discount rate consistent with the long-term market rate at the time, Stern’s conclusions to act did not hold – that the discounted costs exceeded the benefits (Exhibit 12). Since that time, market interest rates have fallen materially and the 30-year gilt currently trades at 1.22%, below the average rate of 1.4% that Stern used in his Review. Today’s low level of market rates increases the future net benefits of avoiding climate change and adds to arguments for action. Moreover, today’s low yields provide an opportunity for governments and private investors to fund the significant investments required to mitigate climate change at relatively favourable rates of interest – as the EU is doing, for example. However, the drop in current market rates from that time avoids the nuance of the debate.
Yet Stern had followed a standard approach to determining the discount rate in the field of public sector economics. Stern used multiple discount rates and an approach based on fixing social welfare equivalence15 , rather than a financial equivalence, more prevalent in shorter term infrastructure or financial planning.
Moreover, the use of discount rate is further affected by the role of uncertainty. In the face of uncertainty, it can be shown16 that a certainty-equivalent rate will tend to the lower discount rate scenarios over longer time periods. This suggests that lower discount rates should be used for assessments in the distant future17 with high uncertainty. This is particularly germane in the context of climate change.
… and differences across space
A further complication in assessing the costs of avoiding climate change is that those costs will differ across different economies, regions and geographies. Our review has, to date, focused on estimated aggregate impacts. Yet it should be clear that different areas will be subject to more or less of the loss of output from mitigating climate change and would be affected to a greater or lesser extent by climate change itself.
Mitigation costs should impact faster-growing economies more, as these economies are forced to forego cheaper sources of energy to fuel that growth – this looks set to be the case for India and China. Oil-producing economies will also face relatively increased costs of mitigation. Moreover, those economies that do not have a large initial stock of renewable energy will face larger transition costs. Exhibit 13 illustrates estimates of the different costs of mitigation to different countries and country groups. The Organization of the Petroleum Exporting Countries members and Russia clearly stand out as expected to suffer the largest losses, reflecting the importance of oil production for these economies. While other countries are expected to bear a broadly similar outlook, it is noteworthy that the European region is estimated to be a net beneficiary, in part reflecting its relatively advanced renewable energy stock to date.
Exhibit 13: Regional differences in transition costs
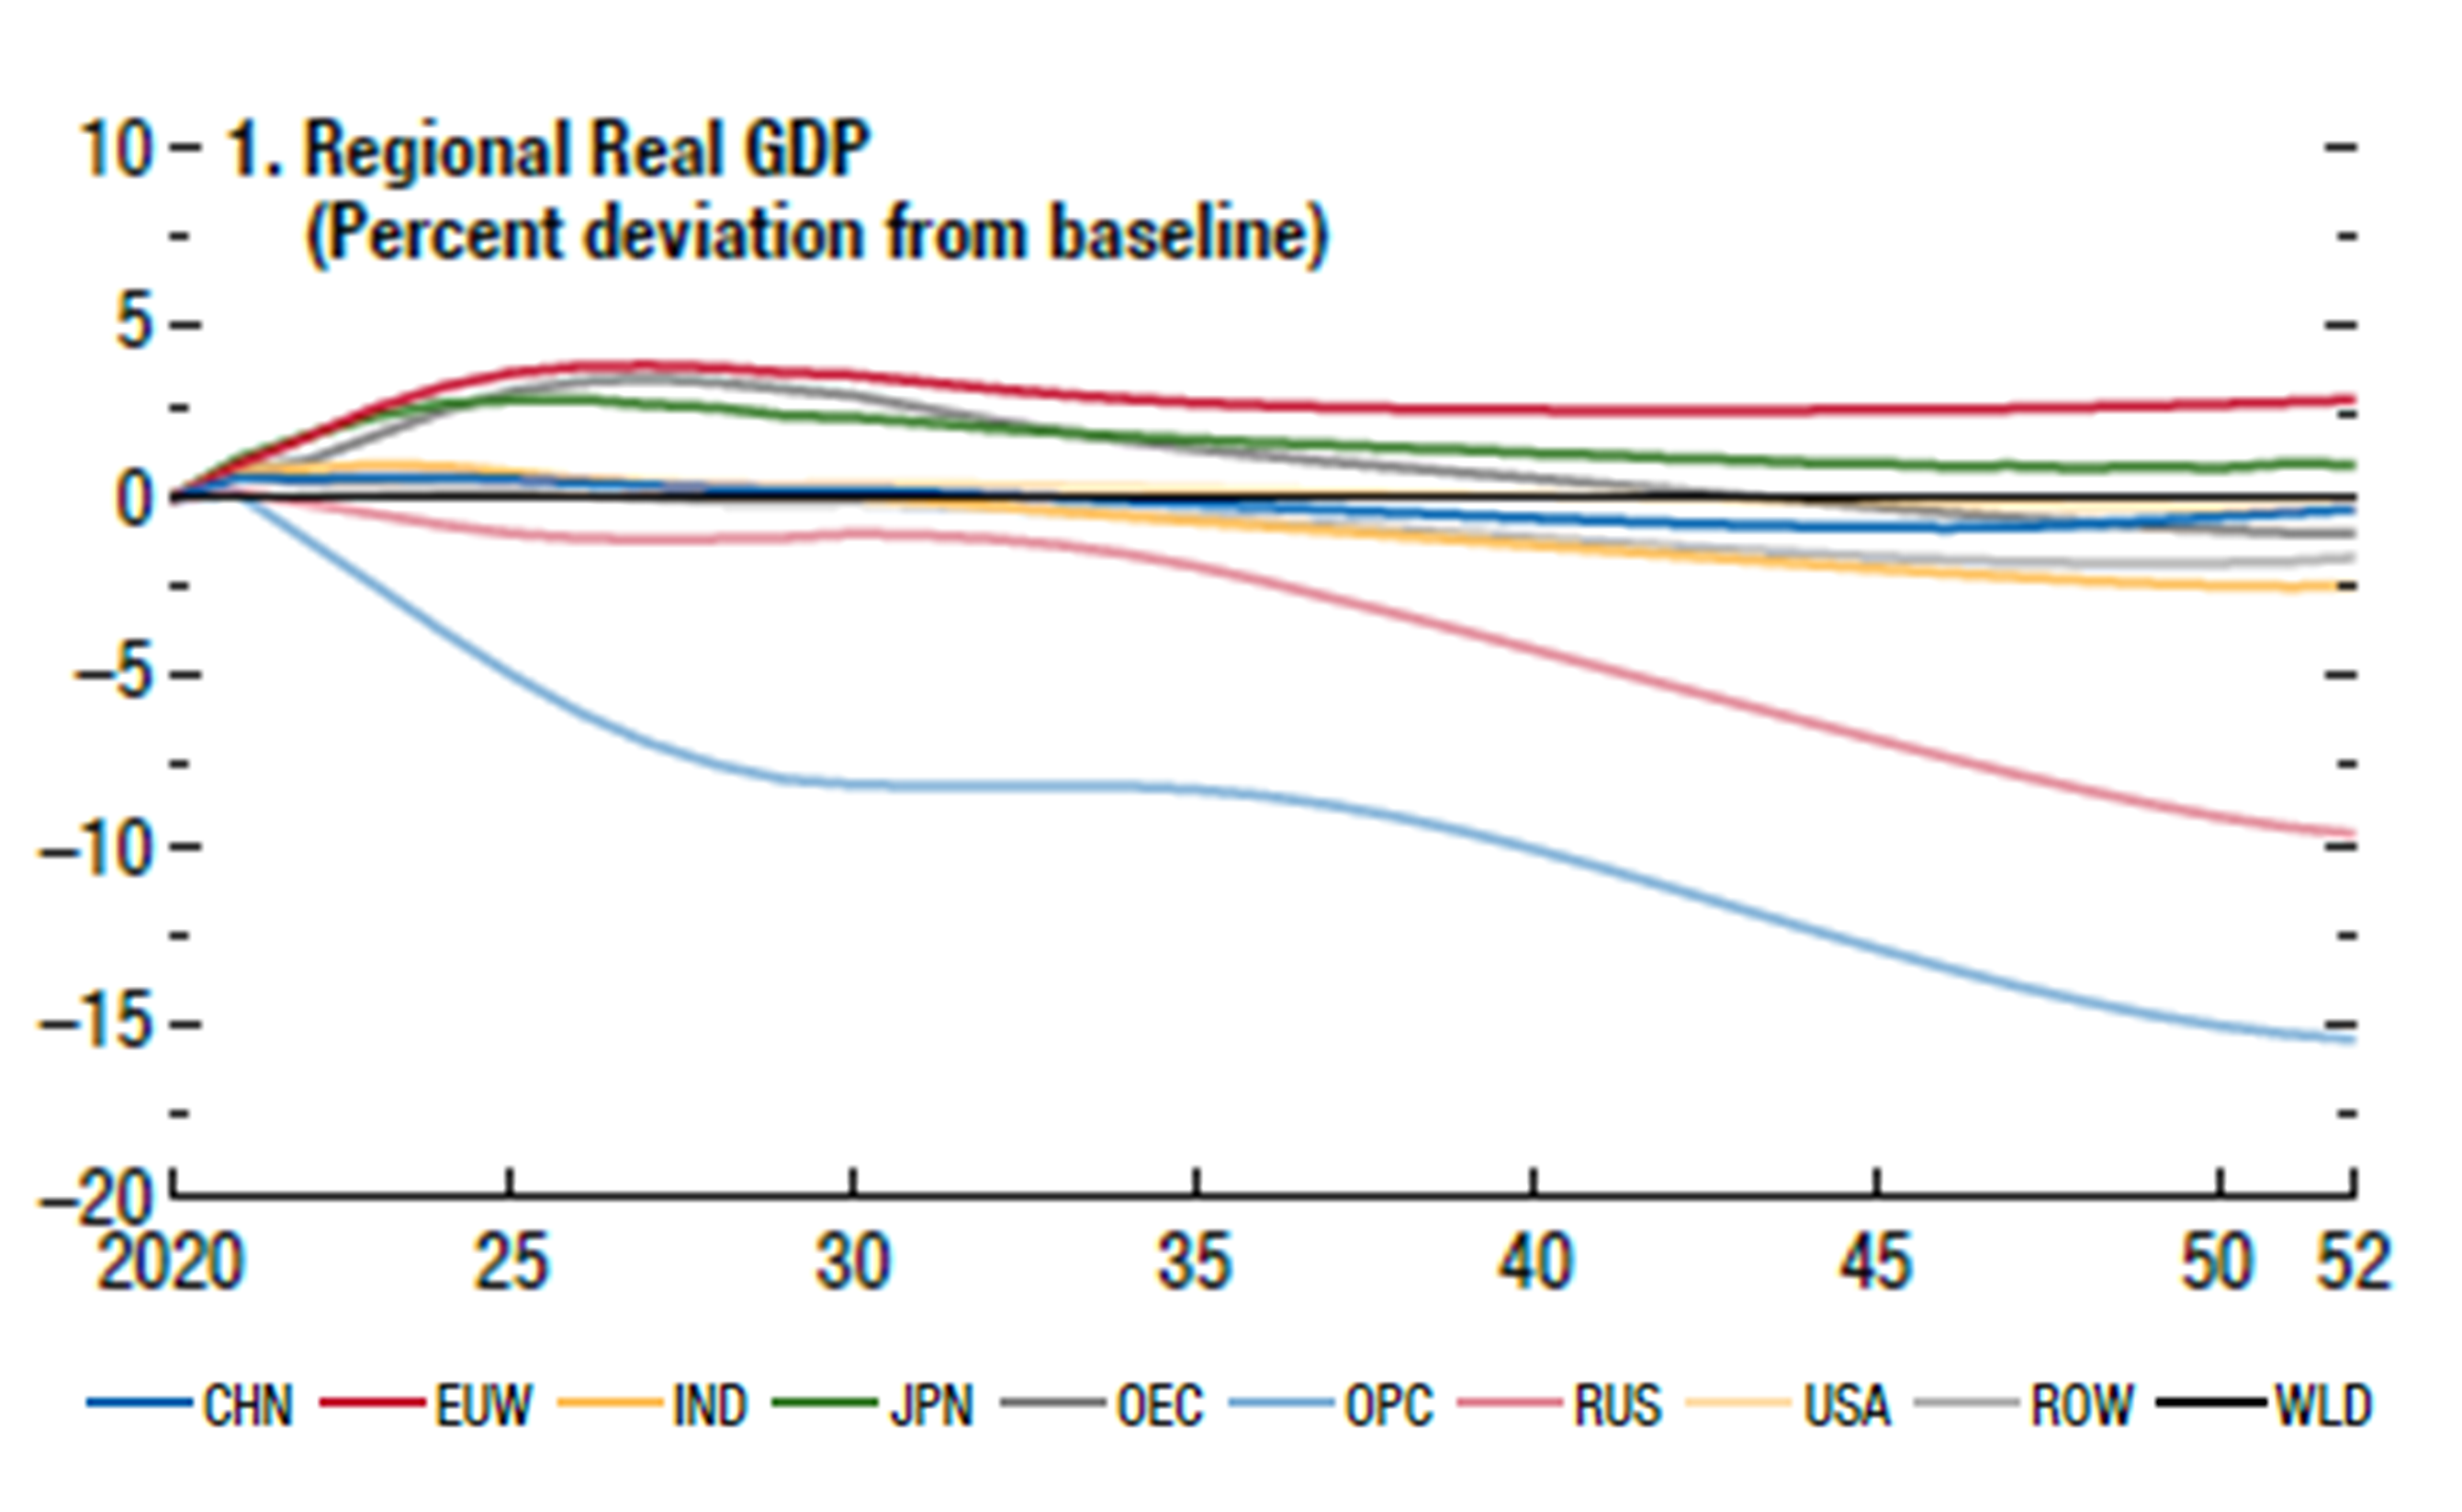
Source: IMF, October 2020
- 4oCcU2l4dGggQXNzZXNzbWVudCBSZXBvcnTigJ0sIElQQ0MsIFdvcmtpbmcgR3JvdXAgSSBjb250cmlidXRpb24sIDIwMjE=
- UGFnZSwgRC4sIOKAnEhvdyBjYW4gUHJlc2lkZW50IEJpZGVuIHRhY2tsZSBDbGltYXRlIENoYW5nZT/igJ0sIEFYQSBJTSBSZXNlYXJjaCwgSmFuIDIwMjE=
- U2hlbiwgUy4gYW5kIFlhbywgQS4sIOKAnENoaW5hOiBEZWNhcmJvbml6aW5nIHRoZSBlY29ub2154oCdLCBBWEEgSU0gUmVzZWFyY2gsIEFwciAyMDIx
- TWVudXQsIEEuLCDigJxFdXJvcGXigJlzIHBhdGggdG8gbmV0IHplcm/igJ0sIEFYQSBJTSBSZXNlYXJjaCwgTWF5IDIwMjE=
- 4oCcSW52ZXN0aW5nIGluIENsaW1hdGUsIEludmVzdGluZyBpbiBHcm93dGjigJ0sIE9FQ0QsIDIwMTc=
- 4oCcRGVjYXJib25pc2F0aW9uOiBUaGUgUmFjZSB0byBOZXQgWmVyb+KAnSwgT2N0b2JlciAyMDE5
- 4oCcRW5lcmd5IFRyYW5zaXRpb246IEhvdyB3aWxsICQxNDB0biBvZiBpbnZlc3RtZW50IGJlIGFsbG9jYXRlZCBhY3Jvc3MgdGhlIGVuZXJneSBzdXBwbHkgY2hhaW4/4oCdLCBVQlMsIE1hcmNoIDIwMjE=
- 4oCcTkdGUyBDbGltYXRlIFNjbmFyaW9zIGZvciBjZW50cmFsIGJhbmtzIGFuZCBzdXBlcnZpc29yc+KAnSwgTmV0d29yayBmb3IgR3JlZW5pbmcgdGhlIEZpbmFuY2lhbCBTeXN0ZW0sIEp1bmUgMjAyMQ==
- IOKAnEdsb2JhbCBSZW5ld2FibGVzIE91dGxvb2vigJ0sIElSRU5BLCBNYXkgMjAyMA==
- S2V5bmVzLCBKLiBNLiwg4oCcVGhlIEdlbmVyYWwgVGhlb3J5IG9mIEVtcGxveW1lbnQsIEludGVyZXN0IGFuZCBNb25leSwgQm9vayAz4oCdLCAxOTM2
- SW50ZXJuYXRpb25hbCBSZW5ld2VhYmxlIEVuZXJneSBBZ2VuY3kgKElSRU5BKSAyMDE5
- TGUgRGFtYW55LCBILiwg4oCcRml0IGZvciA1NTogQSBjYXJib24gcHJpY2luZyB1cGhlYXZhbOKAnSwgQVhBIElNIFJlc2VhcmNoLCBKdWx5IDIwMjE=
- 4oCcVGhlIEVjb25vbWljcyBvZiBDbGltYXRlIENoYW5nZTogVGhlIFN0ZXJuIFJldmlld+KAnSBPY3QgMjAwNi4g
- Tm9yZGhhdXMsIFcuTSwg4oCcVGhlIFN0ZXJuIFJldmlldyBvbiB0aGUgRWNvbm9taWNzIG9mIENsaW1hdGUgQ2hhbmdl4oCdLCBEZWMgMjAwNi4=
- U3BlY2lmaWNhbGx5IGhpcyByYXRlcyB3ZXJlIHNjZW5hcmlvIHNwZWNpZmljIGFuZCBmaXhlZCB0aGUgY29zdHMgb2Ygc29jaWFsIHV0aWxpdHkgb2YgcGVyLWNhcGl0YSBjb25zdW1wdGlvbiwgZW5zdXJpbmcgbm8gbG9zc2VzIGZvciBzb2NpZXR5IGFzIGEgd2hvbGUuIFRoaXMgZGlmZmVycyBmcm9tIGZpbmFuY2lhbCBlcXVpdmFsZW5jZSwgb3IgYW4gb3Bwb3J0dW5pdHkgY29zdCBvZiBjYXBpdGFsLCB0aGF0IGRldGVybWluZXMgYSBwb3RlbnRpYWwgUGFyZXRvIGltcHJvdmVtZW50IC0gYW4gaW1wcm92ZW1lbnQgdG8gYSBzeXN0ZW0gd2hlbiBhIGNoYW5nZSBpbiBhbGxvY2F0aW9uIG9mIGdvb2RzIGhhcm1zIG5vLW9uZSBhbmQgYmVuZWZpdHMgYXQgbGVhc3Qgb25lIHBlcnNvbg==
- R291bGRlciwgTC5ILiBhbmQgV2lsbGlhbXMsIFIuIEMuLCDigJxUaGUgQ2hvaWNlIG9mIERpc2NvdW50IFJhdGUgZm9yIENsaW1hdGUgQ2hhbmdlIFBvbGljeSBFdmFsdWF0aW9u4oCdLCBTZXB0IDIwMTI=
- TmV3ZWxsIGFuZCBQaXplciAoMjAwMykgcHJvdmlkZXMgYW4gZW1waXJpY2FsIGFuYWx5c2lzIHVzaW5nIDIwMCB5ZWFycyBvZiBVUyBpbnRlcmVzdCByYXRlcy4gVGhleSBpbGx1c3RyYXRlIHRoYXQgdW5kZXIgYSByYW5kb20td2FsayBtb2RlbCBvZiBpbnRlcmVzdCByYXRlIHVuY2VydGFpbnR5IHRoZSBjZXJ0YWludHkgZXF1aXZhbGVudCByYXRlIGZhbGxzIGZyb20gNCUgZm9yIHNob3J0IHRpbWUgaG9yaXpvbnMgdG8gMiUgYWZ0ZXIgMTAwIHllYXJzIOKAkyBhbmQgMSUgYnkgMjAwIHllYXJzLg==
Disclaimer
This website is published by AXA Investment Managers Asia (Singapore) Ltd (ARBN 115203622) (“AXA IM Asia”). AXA IM Asia is exempt from the requirement to hold an Australian Financial Services License and is regulated by the Monetary Authority of Singapore under Singaporean laws, which differ from Australian laws. AXA IM Asia offers financial services in Australia only to residents who are “wholesale clients" within the meaning of Corporations Act 2001 (Cth).
This document is for informational purposes only and does not constitute investment research or financial analysis relating to transactions in financial instruments, nor does it constitute on the part of AXA Investment Managers or its affiliated companies an offer to buy or sell any investments, products or services, and should not be considered as solicitation or investment, legal or tax advice, a recommendation for an investment strategy or a personalized recommendation to buy or sell securities.
Due to its simplification, this document is partial and opinions, estimates and forecasts herein are subjective and subject to change without notice. There is no guarantee forecasts made will come to pass. Data, figures, declarations, analysis, predictions and other information in this document is provided based on our state of knowledge at the time of creation of this document. Whilst every care is taken, no representation or warranty (including liability towards third parties), express or implied, is made as to the accuracy, reliability or completeness of the information contained herein. Reliance upon information in this material is at the sole discretion of the recipient. This material does not contain sufficient information to support an investment decision.
All investment involves risk , including the loss of capital. The value of investments and the income from them can fluctuate and investors may not get back the amount originally invested.
Disclaimer
This website is published by AXA Investment Managers Australia Ltd (ABN 47 107 346 841 AFSL 273320) (“AXA IM Australia”) and is intended only for professional investors, sophisticated investors and wholesale clients as defined in the Corporations Act 2001 (Cth).
This publication is for informational purposes only and does not constitute investment research or financial analysis relating to transactions in financial instruments, nor does it constitute on the part of AXA Investment Managers or its affiliated companies an offer to buy or sell any investments, products or services, and should not be considered as solicitation or investment, legal or tax advice, a recommendation for an investment strategy or a personalized recommendation to buy or sell securities.
Market commentary on the website has been prepared for general informational purposes by the authors, who are part of AXA Investment Managers. This market commentary reflects the views of the authors, and statements in it may differ from the views of others in AXA Investment Managers.
Due to its simplification, this publication is partial and opinions, estimates and forecasts herein are subjective and subject to change without notice. There is no guarantee forecasts made will come to pass. Data, figures, declarations, analysis, predictions and other information in this publication is provided based on our state of knowledge at the time of creation of this publication. Whilst every care is taken, no representation or warranty (including liability towards third parties), express or implied, is made as to the accuracy, reliability or completeness of the information contained herein. Reliance upon information in this material is at the sole discretion of the recipient. This material does not contain sufficient information to support an investment decision.
All investment involves risk , including the loss of capital. The value of investments and the income from them can fluctuate and investors may not get back the amount originally invested.