

Too much of a good thing
Recent volatility in global technology shares has been partly caused by better-than-expected US economic data which led to market expectations for higher fed funds rates in the future.
US private non-farm payrolls rose by 120,000 in May, data released on 5 June showed - more than forecast, while data for the prior two months was revised upwards.
The average gain for the last three months is now 166,000, compared to -4,000 in the preceding three months. Importantly, job creation was strong not just in healthcare but also across several other industries.
The adult unemployment rate fell, suggesting artificial intelligence-led layoffs are, for now, more feared than realised. The unemployment rate for 20-to-24-year-olds also dropped and is lower than it was a year ago, meaning that AI is also not unduly hindering young people just entering the workforce from finding jobs.
Taken together, the implication was that one of the primary justifications for a reduction in the US Federal Reserve’s primary policy rate — namely, a weak US labour market — no longer seemed viable.
Market reaction
Following the report’s release, expectations for the fed funds rate at the end of the year jumped 10 basis points, bringing the probability of a full 25bp hike by end-2026 to near 100%, according to Bloomberg.
Equity market reaction, and in particular ‘long earnings duration’ technology shares (technology sector earnings tend to come further out in the future than for other sectors) was swift: the Nasdaq index dropped by 5% as the discount rate applied to those earnings rose.
This encouraging economic data followed the earlier ISM Purchasing Managers’ Index report, which showed continued expansion in both the services and manufacturing sectors. The manufacturing figure was actually the highest in four years (despite tariffs and rising energy costs).
Complementing the positive economic data were modestly promising inflation numbers. The May core Consumer Price Index rose in line with forecasts at 2.9% (the headline was 4.2%, reflecting the jump in petrol prices), but the monthly change was just 0.2% compared to a forecast of 0.3%.
The reason for the lower monthly figure was negative goods inflation, suggesting that any inflationary impact from tariffs has faded. Offsetting this, however, was still elevated core services inflation, which is running above 4%, explaining the market’s expectation for a hike in fed funds this year. Producer Price Index inflation has also come in hot.
The fundamental picture is of above-trend US growth and hence higher inflationary pressures above and beyond the impact of energy prices. This is a broadly positive environment for equity markets, even if it also means somewhat higher interest rates.
Earnings expectations and valuations
The sell-off in technology shares did not just reflect higher interest rates, however. After the 5% decline following the US labour market data, the Nasdaq index dropped another 2% before rebounding.
The subsequent fall was partly a function of ongoing worries about the outlook for earnings and valuations.
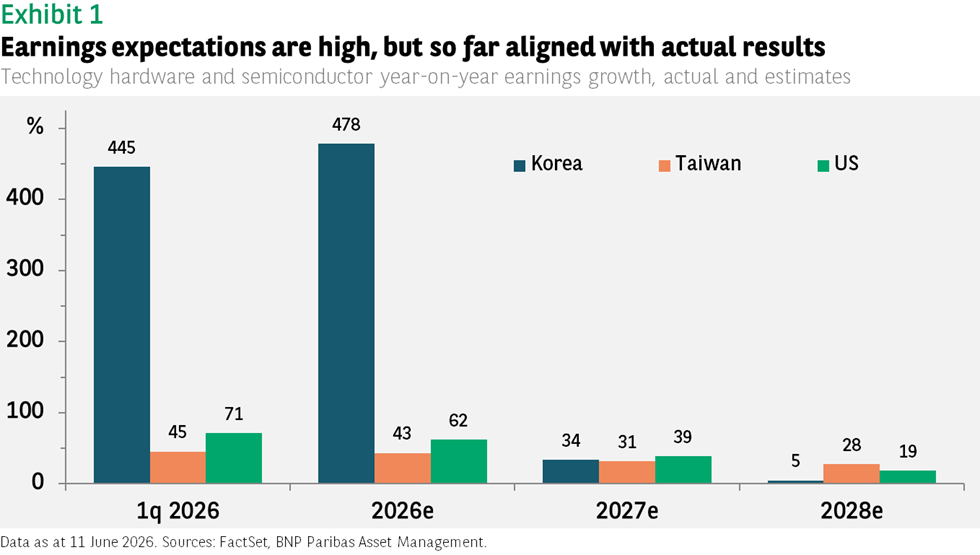
Expectations for earnings growth are undoubtedly high. Korean hardware stocks are forecast to see 478% growth this year, according to FactSet estimates. The 40%-to-60% gain for Taiwan and the US seems small in comparison but are still impressive figures.
Given the results companies posted in the first quarter, these forecasts do not appear wildly unrealistic (see Exhibit 1).
But with such high hopes, any sign that actual results may not measure up is quickly reflected in lower equity prices. If the estimates are even partly accurate, however, technology indices should see solid support from rising earnings in the quarters ahead.
The positive results from the first quarter help explain how, despite the significant year-to-date gains in tech equity index prices, valuations remain reasonable. Korean hardware shares have advanced 177%, in Taiwan 61%, and in the US 34%.
But taking the z-score (which measures how many standard deviations a data point is above or below the mean) of the forward price-to-earnings ratio as a measure of valuations, the average score for Korea is -0.2, 1.2 for Taiwan, and 0.7 for the US.
Not cheap, but at the same time not wildly out of line with historical levels. And relative to the potential earnings growth in the future, multiples at an index level today do not look unreasonable.
To take another comparison, the P/E ratio for the Nasdaq index in the run up to the bursting of the dot.com bubble in March 2000 peaked around 48 times; today it is 23.
Data sources: FactSet, BNP Paribas Asset Management as of 11 June 2026 (unless otherwise stated). Past performance should not be seen as a guide to future returns.


Disclaimer
BNP Paribas Group's acquisition of AXA Investment Managers was completed on 1 July 2025, and AXA Investment Managers is now part of BNP Paribas Group.
This website is published by AXA Investment Managers Australia Ltd (ABN 47 107 346 841 AFSL 273320) (“AXA IM Australia”) and is intended only for professional investors, sophisticated investors and wholesale clients as defined in the Corporations Act 2001 (Cth).
This publication is for informational purposes only and does not constitute investment research or financial analysis relating to transactions in financial instruments, nor does it constitute on the part of BNP Paribas Asset Management or its affiliated companies an offer to buy or sell any investments, products or services, and should not be considered as solicitation or investment, legal or tax advice, a recommendation for an investment strategy or a personalized recommendation to buy or sell securities.
Market commentary on the website has been prepared for general informational purposes by the authors, who are part of AXA Investment Managers. This market commentary reflects the views of the authors, and statements in it may differ from the views of others in BNP Paribas Asset Management.
Due to its simplification, this publication is partial and opinions, estimates and forecasts herein are subjective and subject to change without notice. There is no guarantee forecasts made will come to pass. Data, figures, declarations, analysis, predictions and other information in this publication is provided based on our state of knowledge at the time of creation of this publication. Whilst every care is taken, no representation or warranty (including liability towards third parties), express or implied, is made as to the accuracy, reliability or completeness of the information contained herein. Reliance upon information in this material is at the sole discretion of the recipient. This material does not contain sufficient information to support an investment decision.
All investment involves risk , including the loss of capital. The value of investments and the income from them can fluctuate and investors may not get back the amount originally invested.